
VowSpace: A vowel formant analysis application
Feedback form

I have been receiving helpful emails from users of VowSpace. Your feedback, bug reports, feature requests, and usage notes directly help improve the application. If you ask me for something, I will most likely add it at my earliest convenience.

If you have tried or used VowSpace, I would really appreciate it if you could fill out this anonymous feedback form, too. :)

https://forms.gle/D9P6TYfAhiiY4swx8
VowSpace is an open-source desktop application developed with the aim of acquiring, visualizing, normalizing, comparing, and linguistically analyzing vowel formant frequencies from audio files and/or datasets.
In phonetic and sociophonetic research, analyzing vowel formants is essential for understanding language variation, speaker physiology, and vowel space. Researchers often use general-purpose software like R or Praat, which require advanced skills and time for custom visualizations. VowSpace was created as an open-source tool for vowel space plotting, combining raw and normalized data. While R packages like phonR and vowelPlot, and Praat offer similar functions, they either assume programming expertise or lack accessible GUI features for normalization and visualization.
YOU MAY HAVE A LOOK AT THE TUTORIALS I PROVIDED AT TUTORIAL INSTRUCTIONS! 🙂

| Version | Log |
| VowSpace-v.1.4.2 | VowSpace v1.4.2 Release Notes New Features: Added new normalization methods: Nearey1, Nearey2, and Bark Difference Metric. Introduced additional scale conversion options: Bark, Log, Mel, and ERB. Enabled the NavigationToolbar in Audio Analysis Tools, which allows users to: – Zoom in/out – Change the color palette – Modify visualization settings – Save with different configurations Introduced a brand-new application icon that I drew myself. 🙂 Improvements: Modularized the previously monolithic codebase into more structured, maintainable components. Significantly improved the overall code organization. Made the DataFrame Editor window a bit larger for better visibility and usability. Documentation: Added some nifty tutorials to the GitHub repo to guide users through features and usage! |
| VowSpace-v.1.4.1 | Release Notes: Bug Fixes: Fixed a bug that inverts the axes upon importing data. Fixed a bug that made the app crash when the size of the canvas is below 1 pixel. New Features: Added Ellipses and Qhulls to connect related data for better readability. Group by Vowel option: Normally the application would connect the data that belonged to the same speaker. With this update, the user can now connect the same vowels for different purposes. Improvements: Made the canvas bigger for better visualization. Made the default and minimum size of the application 800×800. Changed the default dpi for saving images from 600 to 1200 for better readability. Rearranged the menus for improved navigation. |
| VowSpace-v.1.4.0 | Release Notes: Bug Fixes: Fixed bug causing program crash when a cell is empty in the dataframe. Fixed bug causing program crash when applying a qhull on 2-dimensional data. New Features: Added f0 (fundamental freq), f3, and f4 formants for both plotting and acquiring. Added option to choose which formants to plot. Added a dataframe editor to add, edit, and delete data using a UI. Changes: Updated dataframe methods: clear_data, read, and write.Modified Bark and Lobanov normalization methods to include all formant frequencies. (Previously, the program only used the f1 and f2 integers. With this update, users can now select the data they need using the UI, without needing to include unnecessary rows in their dataset. Also, if a cell in the dataset is empty for any reason, the data logic of the application simply takes it as a NaN value and won’t crash.) |
| VowSpace-v1.3.0 | Release notes: Added ‘Audio Analysis Tools’, a separate window that the user can open through the VowSpace’s main user interface. Using this window, the user can read an audio file and get useful information about it such as intensity, pitch and formant frequencies. Added an IPA keyboard for convenience. Added the option to exclude a title for the plot. |
| VowSpace-v1.2.0 | Release notes: The initial release for Mac. 🙂 Fixed a bug regarding the Bark Difference Metric method. Added more labeling options. |
Vowel Plotting in VowSpace
VowSpace uses the Matplotlib (3.8.2) (Hunter, 2007) library to draw a canvas and visualize the data. When plotting vowel formants, VowSpace utilizes a rectangular template with f1 value on the rightmost side and f2 value on the bottommost side of the screen with rulers on the opposite sides of the values as shown in the figure 1. The vowels that belong to different sources are represented with points with different colors as shown in the figure 2.

Empty canvas
Data added and ‘Show Labels for Vowels’
‘Connect with Qhull’ and ‘Show Grids’, each individual speaker can now be identified with an assigned color
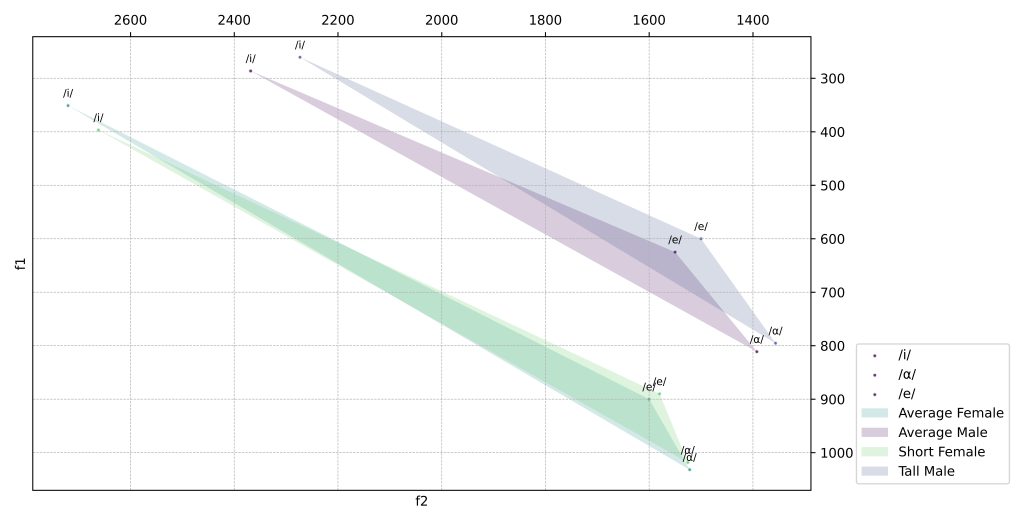
‘Show Legend’
Vowel Normalization in VowSpace
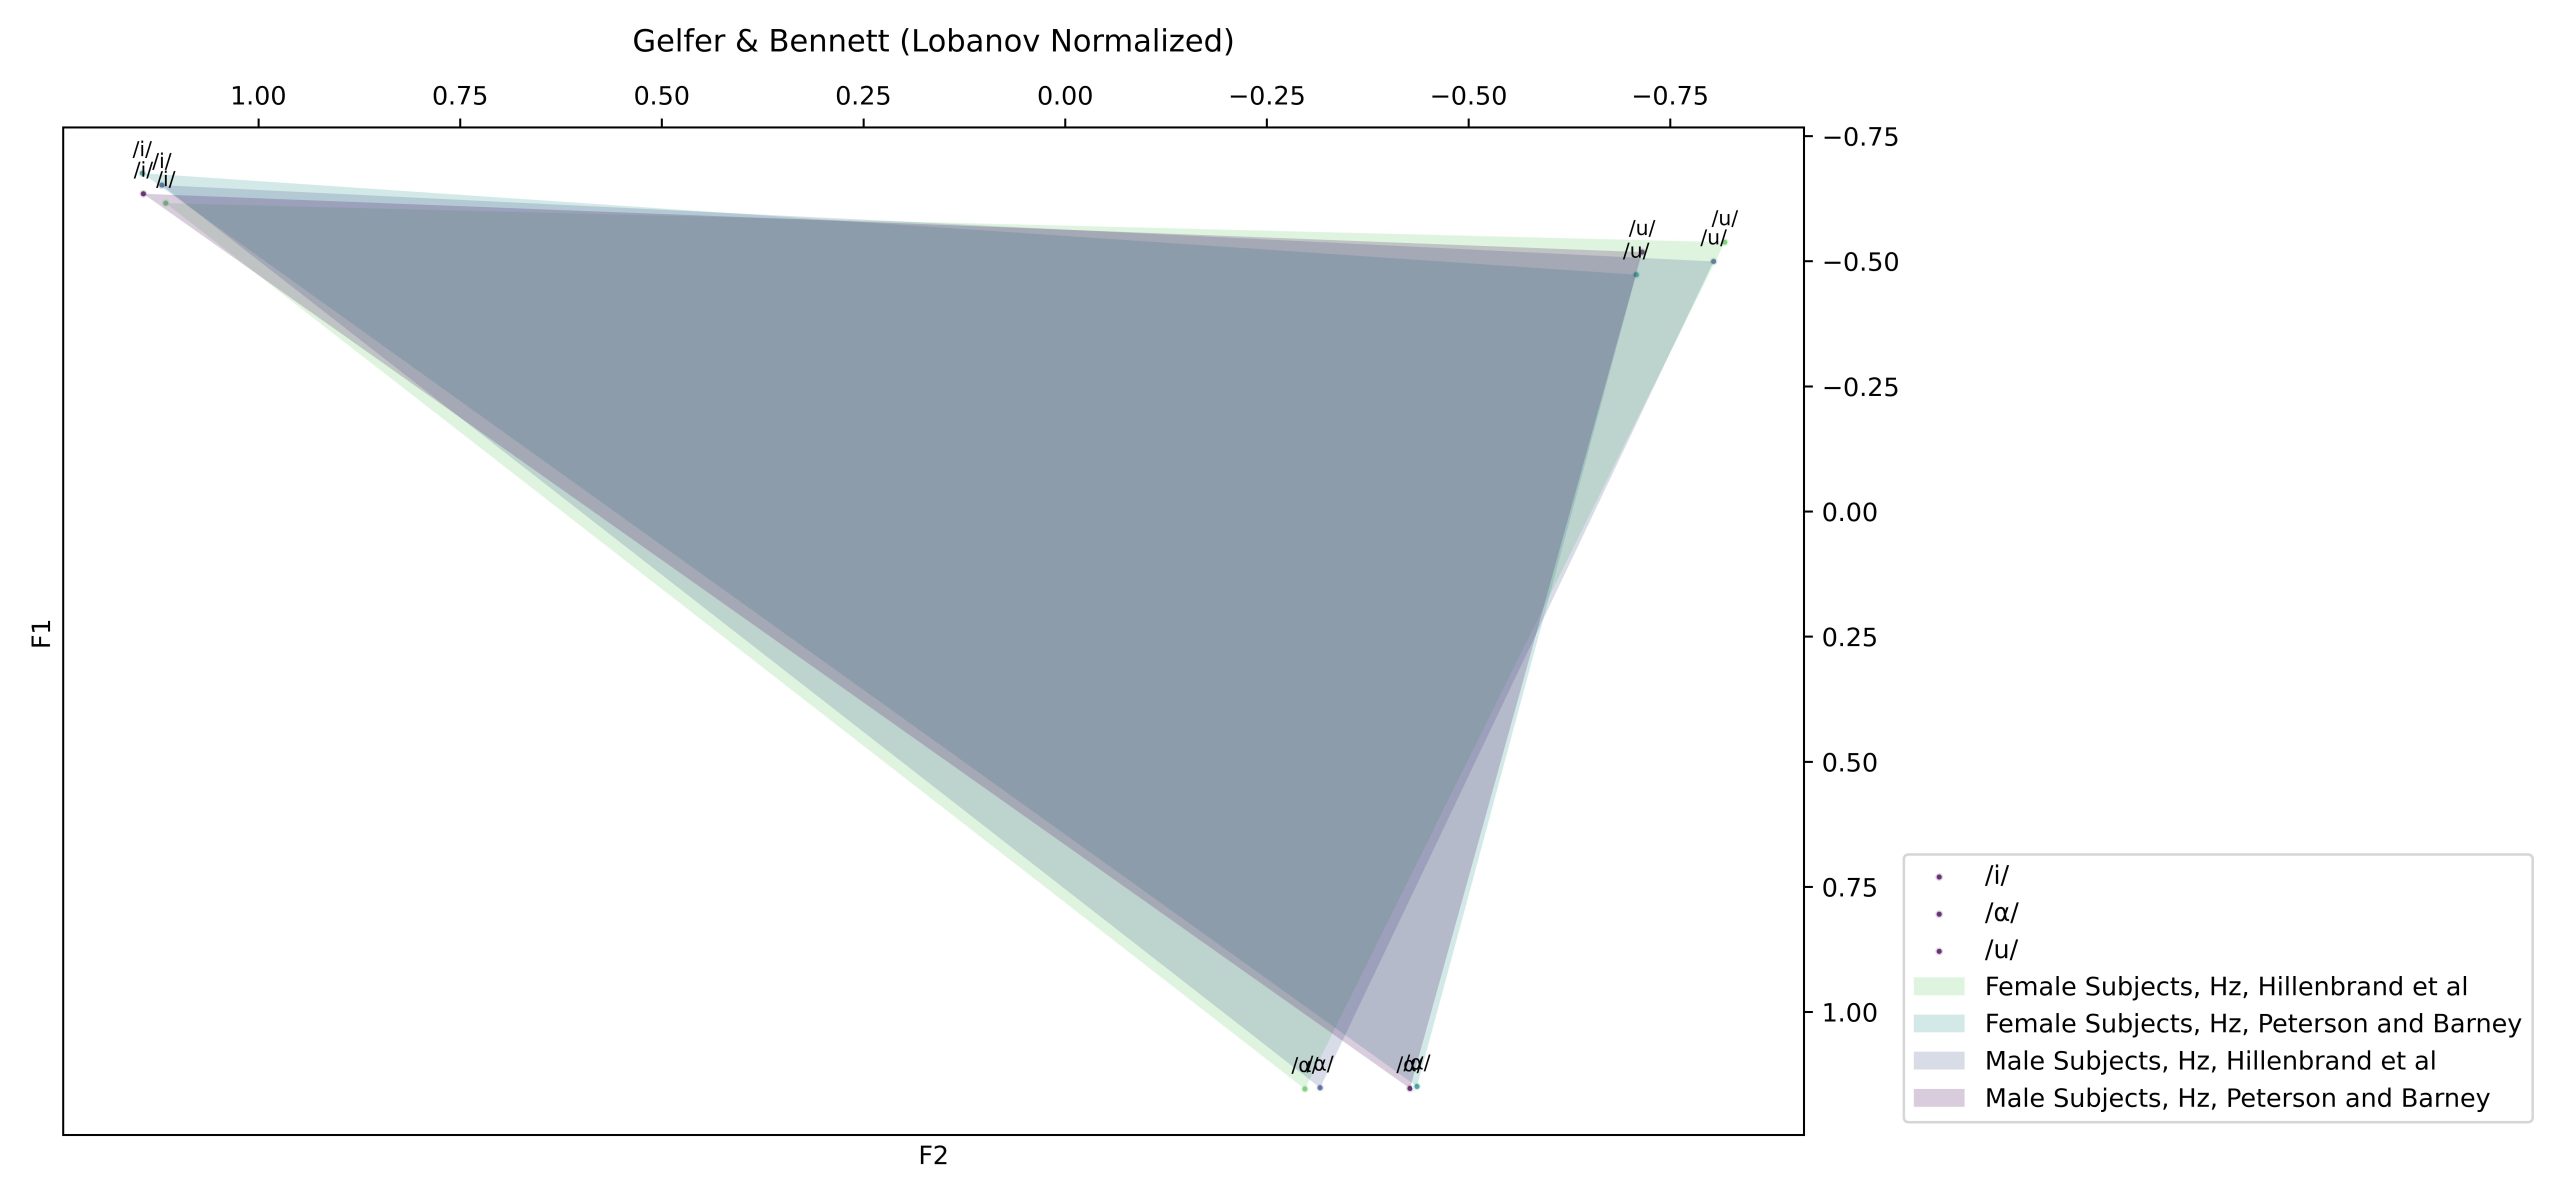
VowSpace also provides options for normalizing the vowel formants under the “Normalization Settings” menu. In the latest stage of development, two normalization methods have been implemented to the application. The first method is an implementation of the Lobanov normalization method put forward by Lobanov (1971) by Nearey (1977) and Adank et al. (2004). The second one is the Bark Difference Metric by Traunmüller (1997). Both methods have been implemented to Python by Remirez (2022), (Remirez, 2022).
VowSpace uses the following formulas for the normalization processes:
F_n[V] = \frac{F_n[V] – \text{MEAN}_n}{S_n} \text{Lobanov: } x: \frac{x – \text{x.mean()}}{\text{x.std()}} Z_i = \frac{26.81}{1+\frac{1960}{F_i}} – 0.53 \text{Bark: } x: \frac{26.81}{1+\frac{1960}{x}} – 0.53Nearey (1977) and Adank et al. (2004)
(Took help from NORM’s Vowel Normalization Methods (v. 1.1), a brilliant source for vowel formant normalization from the University of Oregon and LingMethodsHub, an incredible collection of linguistics methods!)
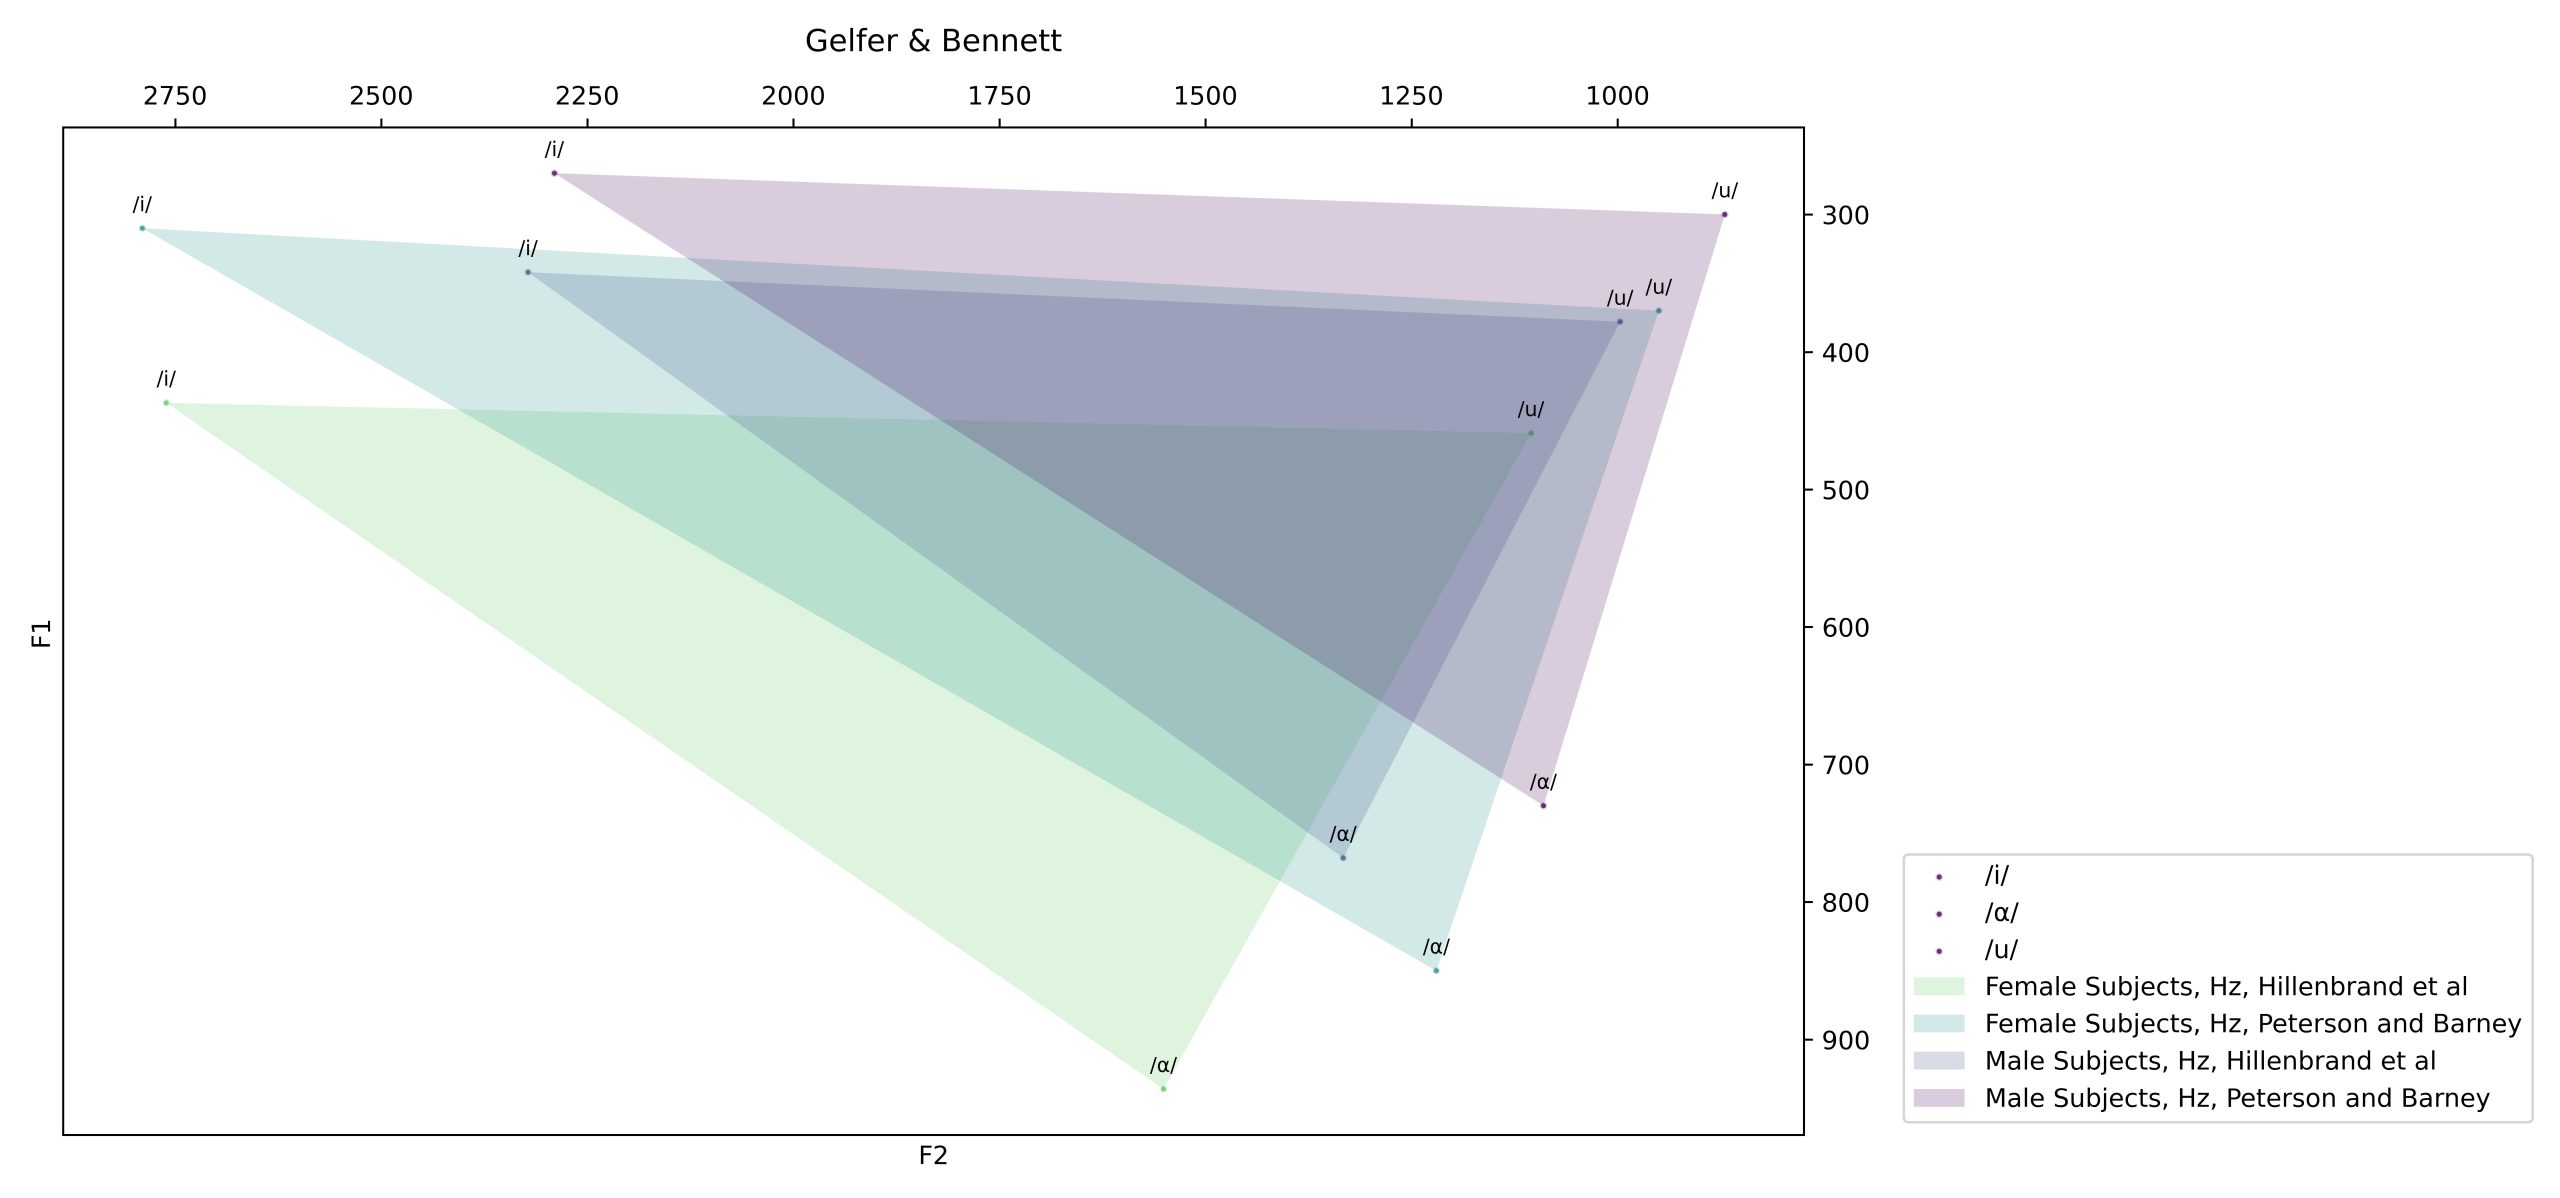
The normalized values are shown in the data frame and as scatterplots as follows:
| vowel | f1 | f2 | speaker | bark_f1 | bark_f2 | zsc_f1 | zsc_f2 |
| /i/ | 270 | 2290 | Male Subjects, Hz, Peterson and Barney | 2,716054 | 13,91586 | -0,63465 | 1,142678 |

Audio Analysis Tool
Audio Analysis Tool is a separate window that the user can be accessed through the VowSpace’s main user interface.
Then the user can read an audio file and get useful information about it such as intensity, pitch and vowel formant frequencies.
I am still working on a method for playing audio better!
(I used the Parselmouth library for coding this class. It is an incredible Python interface to Praat! I would like to personally thank Yannick Jadoul for answering my questions on the library’s forum. His help was invaluable in resolving a few bugs along the way. :))
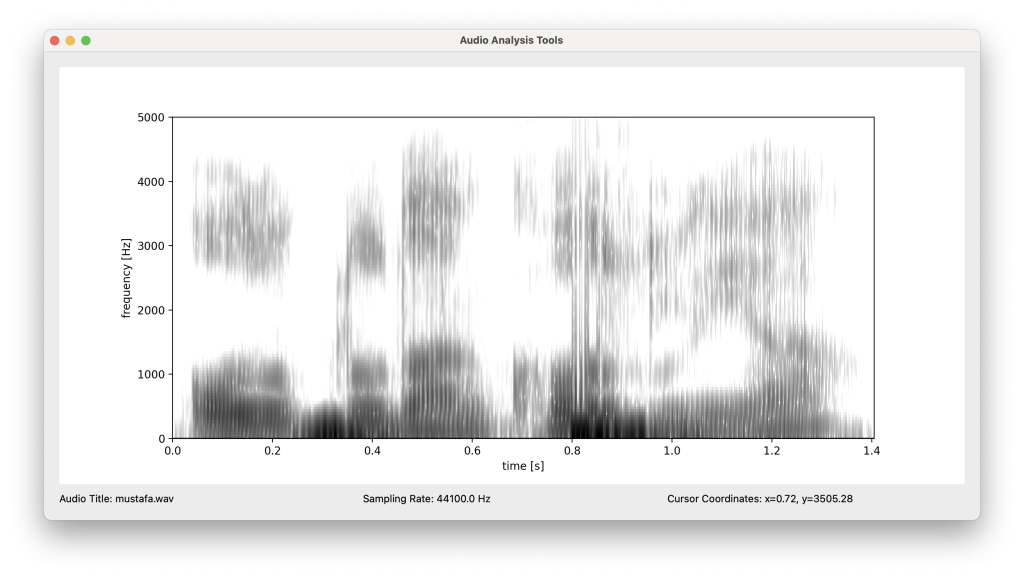

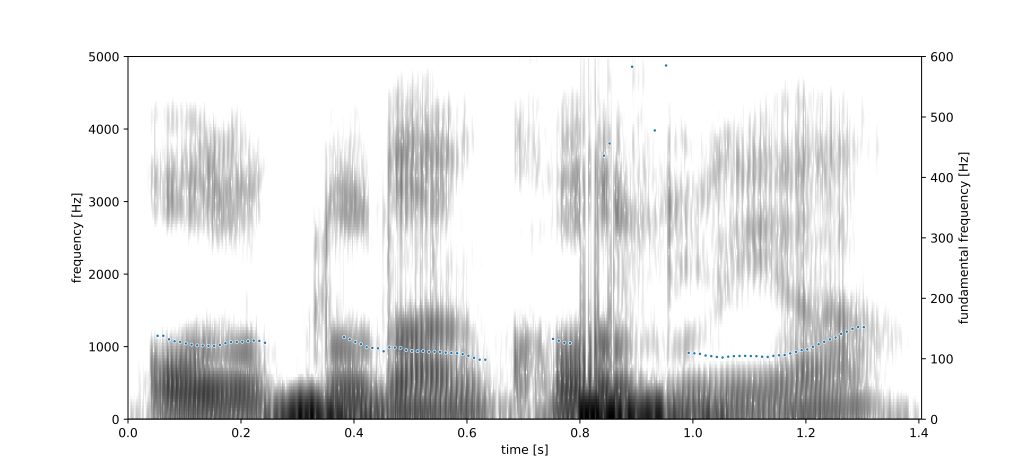
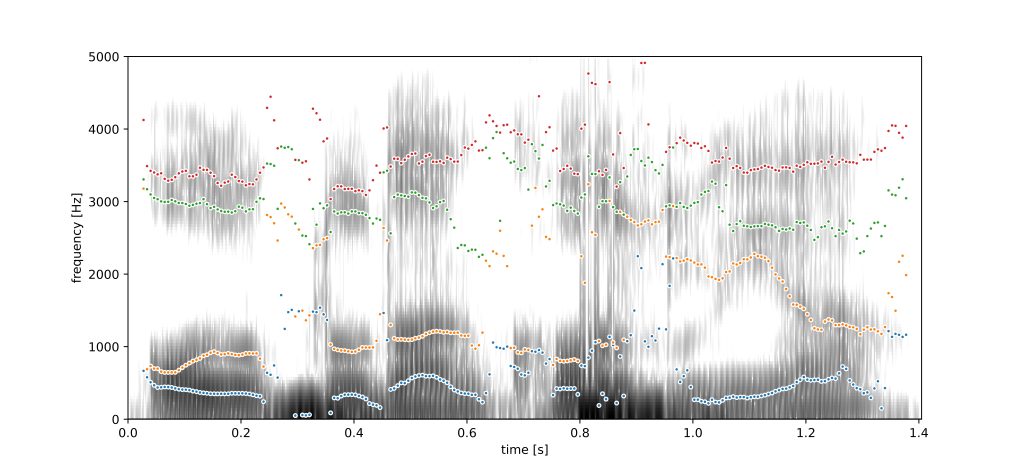
In the most current stage of development, the user is able to add the formant frequencies on any given t to the VowSpace interface by right clicking on the plot on the audio analysis window.
f1: 318.7498196551267 Hz, f2: 2244.791430127414 Hz, f3: 3265.2234964891854 Hz
f1: 202.5469110273425 Hz, f2: 1463.2391801863246 Hz, f3: 2555.2412955841573 Hz
f1: 393.4744587181852 Hz, f2: 1490.5625659370821 Hz, f3: 3055.3888257293906 Hz
Data Table Format
The minimum data table for any data to be read by VowSpace is as follows:
| vowel | f1 | f2 | speaker |
| /æ/ | 123 | 1234 | Markus |
The only necessary rows are ‘vowel’, ‘f1’, ‘f2’, and ‘speaker’. When any data is inputted through the user interface, a dataframe is created with this information. Columns like ‘bark_f1’ for the Bark metric, logarithmic values like ‘log_f1’ and z-scores like ‘zsc_f1’ are also supported.
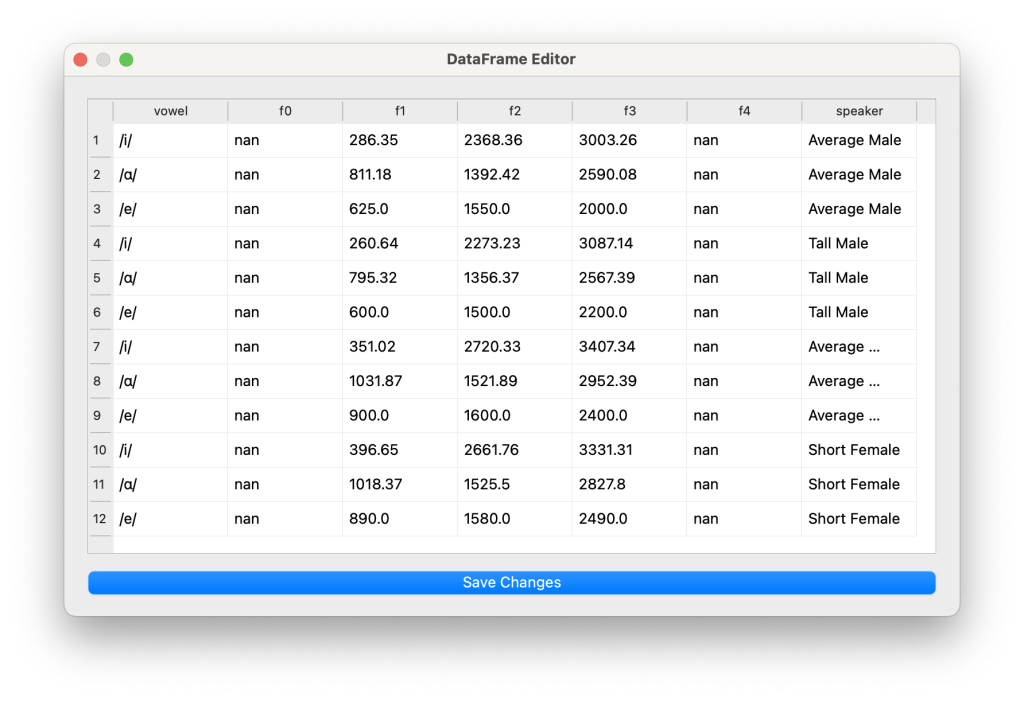
DataFrame Editor
DataFrame Editor is a separate window to make small adjustments on the data that you’re working on without relying on any other application. When you use the ‘Save Changes’ function, the scatterplot automatically updates with the latest data. The altered data can also be saved as a separate .csv, .xls, or .xlsx file thought the ‘Save Data As…’ action.
IPA Keyboard
As phoneticians, we love the IPA (International Phonetic Alphabet)! There is a dedicated window to input some vowels on the IPA as well!

Examples
The following demonstrates the use of VowSpace for phonetic research.
Plotting the Vowel Space of Turkish
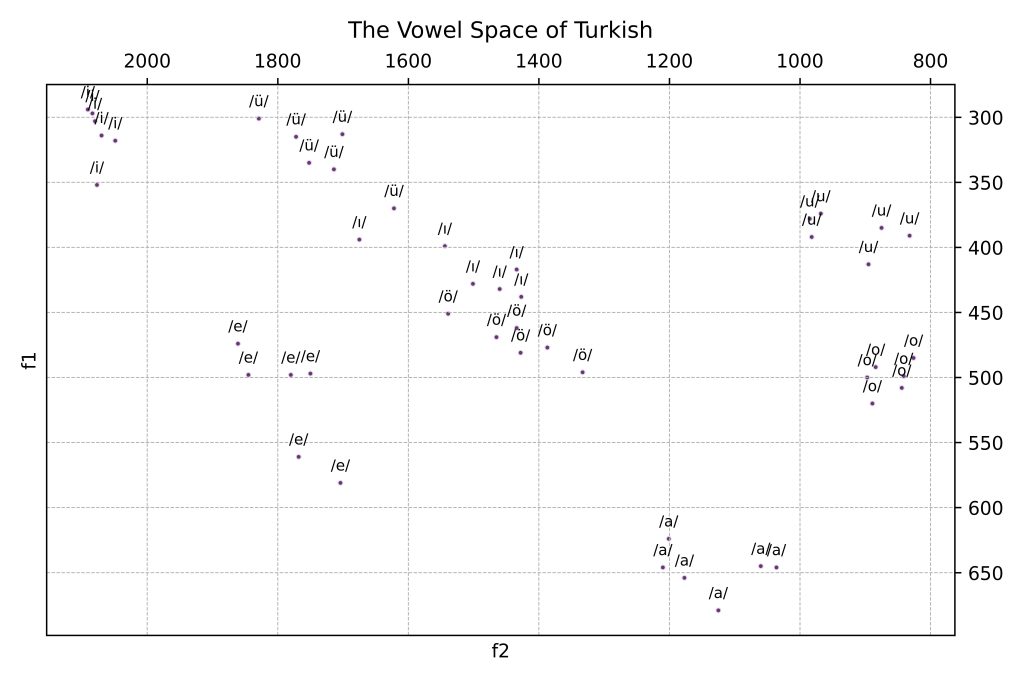
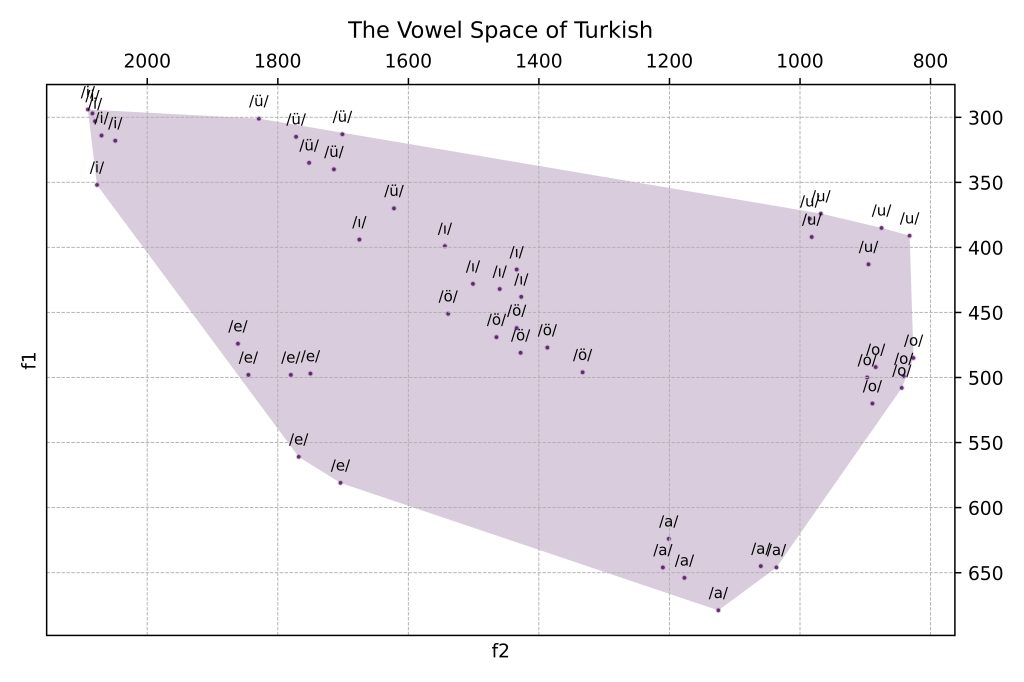
With this example, we aim to visualize the data from a great paper on vowels in Turkish to gain a clearer understanding of the vowel space of Turkish.
(Data from: Korkmaz, Y., & Boyaci, A. (2018). Classification of Turkish Vowels Based on Formant Frequencies. 2018 International Conference on Artificial Intelligence and Data Processing (IDAP), 1–4. https://doi.org/10.1109/IDAP.2018.8620877)
The dataset is composed of different realizations of the vowels /a/, /e/, /ɯ/, /i/, /o/, /œ/, /u/ and /y/ (I kept the phonologic transcriptions in the dataset as is).
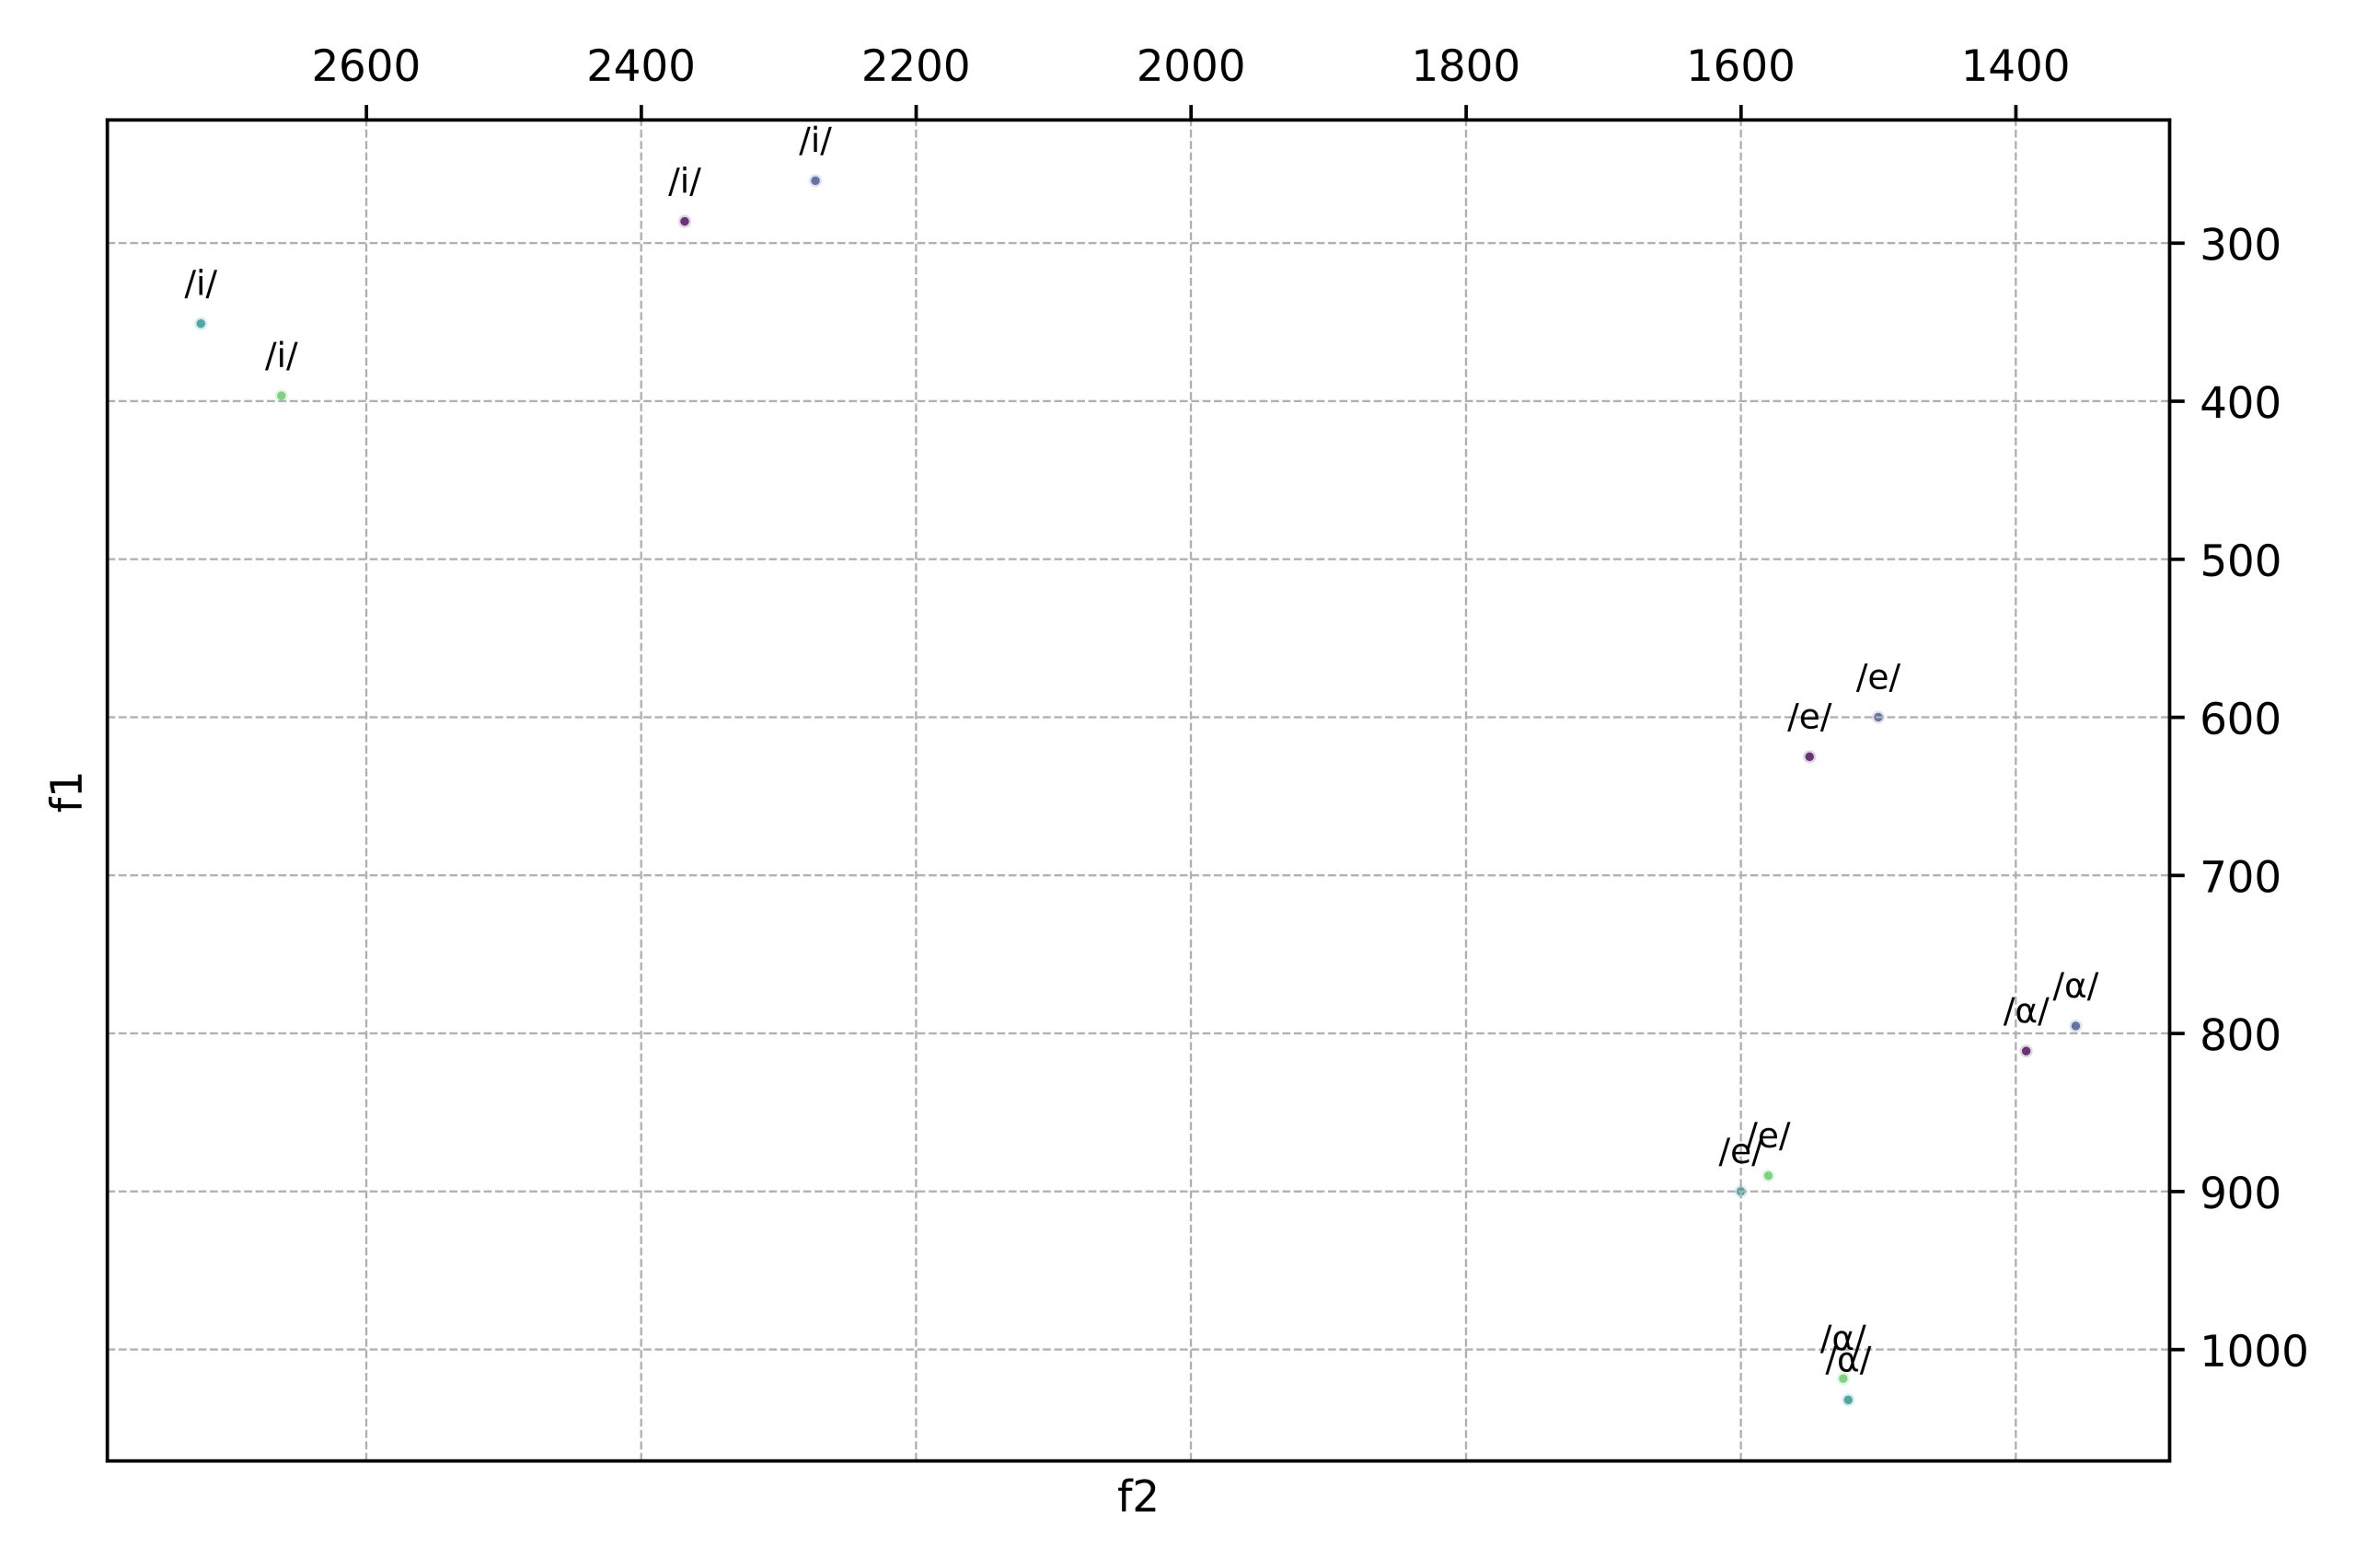
When imported to VowSpace with the ‘Show Grids’ and ‘Show Labels for Vowel(s)’ options activated, our data looks like this:
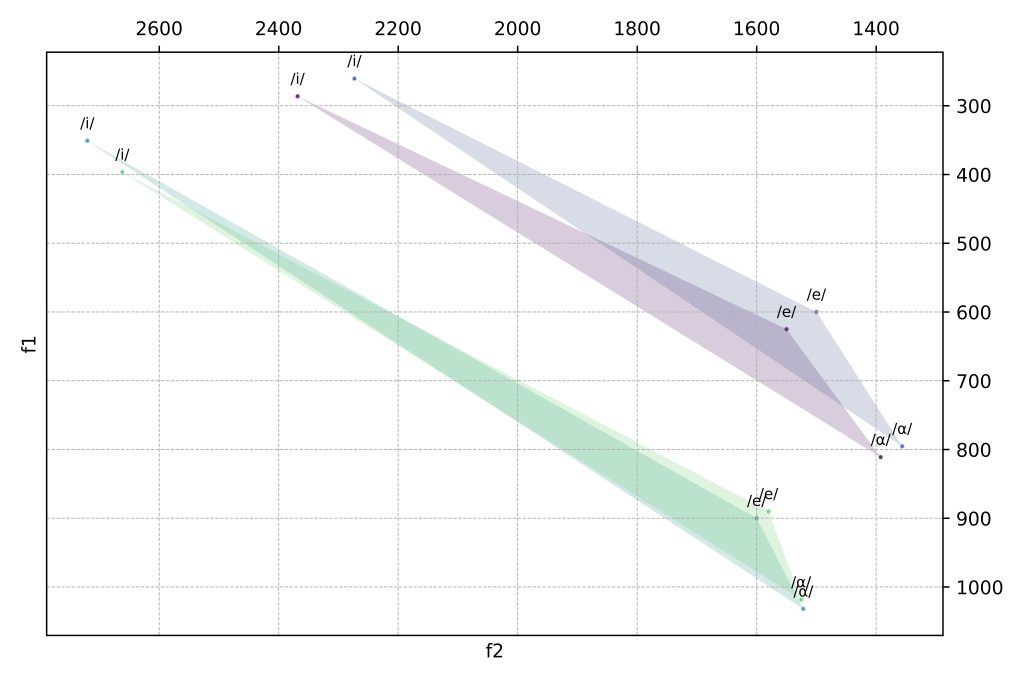
To achieve a more conventional, quadrilateral-like view of the vowel space, we use the ‘Connect with Qhull’ action:
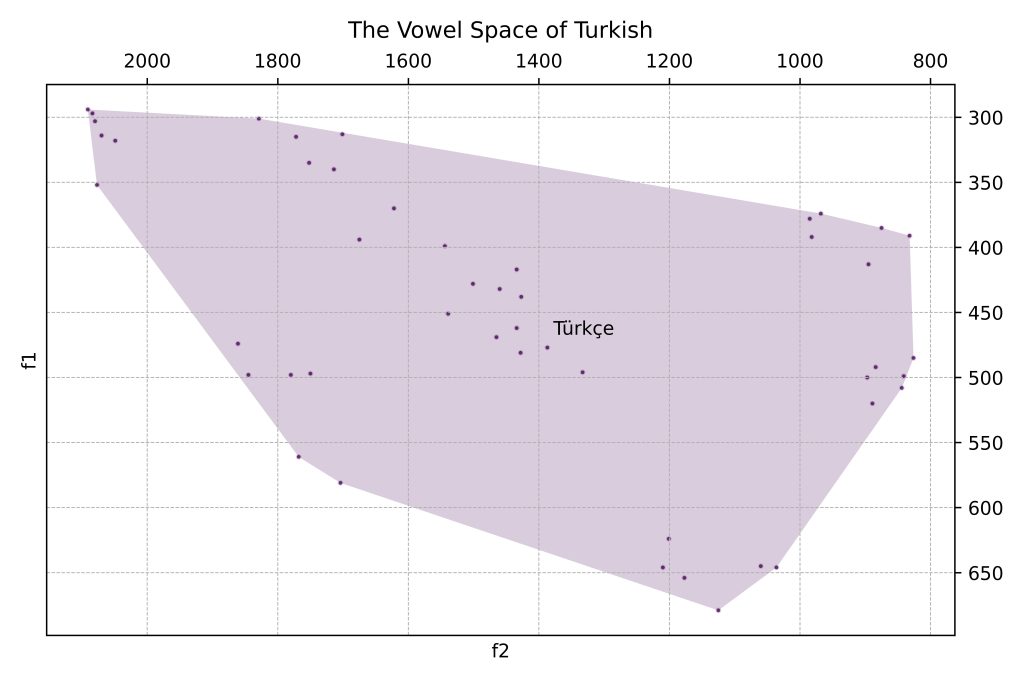
In some cases, we might want to see where individual vowels are articulated. We use the ‘Group by Vowel’ action to take unique phonemes into account rather than the speaker/language:

Using Qhulls, we can see the places of articulation clearer:

Considering the limited number of data, using ellipses to visualize these may be a better option:
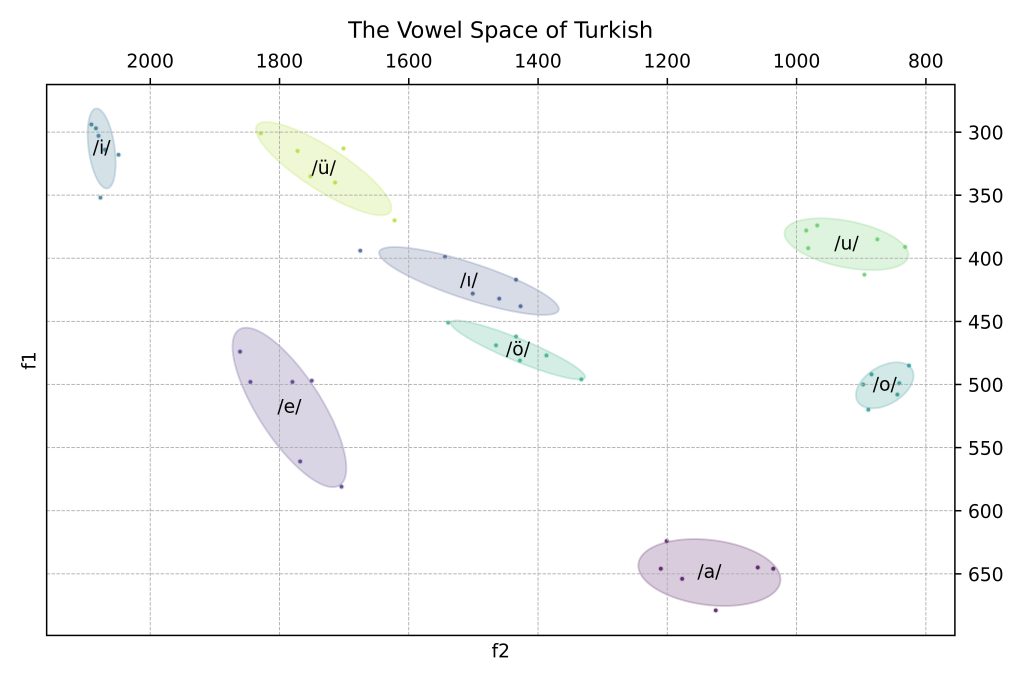
Ellipse logic: The covariance matrix captures the variance and covariance of the data points in your subset, the eigenvalues give the length of the principal axes of the ellipse and the eigenvectors give the direction of the principal axes.
(I took help from this useful website when working on this method: Making vowel plots in R (Part 1), Joey Stanley. It is an awesome resource if you are working on vowel visualization!)
eigvals, eigvecs = np.linalg.eigh(cov)

#This ensures the eigenvalues and corresponding eigenvectors are ordered correctly, typically from largest to smallest eigenvalue.

order = eigvals.argsort()[::-1]
eigvals, eigvecs = eigvals[order], eigvecs[:, order]
Suppose you have a dataset with a covariance matrix Σ. The eigenvectors of Σ might be:
v_1 = \begin{pmatrix} 1 \\ 0 \end{pmatrix}, \quad v_2 = \begin{pmatrix} 0 \\ 1 \end{pmatrix}These eigenvectors indicate that the principal directions of the data spread are along the x-axis and y-axis. If the corresponding eigenvalues are:
\lambda_1 = 4, \quad \lambda_2 = 1Then, the lengths of the axes of the ellipse are:
2\sqrt{4} = 4 \quad \text{and} \quad 2\sqrt{1} = 2The chi-squared distribution is used to scale the eigenvalues to create a confidence ellipse. The function calculates the value from the chi-squared distribution with 2 degrees of freedom that corresponds to a cumulative probability of .67. This value is then used to scale the eigenvalues to determine the size of the ellipse.
\text{scale\_factor} = \sqrt{\chi^2\text{.ppf}(0.67, \text{df}=2)}Acknowledgments
I am not formally trained as a programmer and am the sole developer of this application, so there may be bugs, and the code might appear amateurish. VowSpace is still in development, and I am continuously adding new features as I learn new methods and techniques. I am doing my best to keep VowSpace updated and actively invite researchers to try it out and provide feedback. However, please double-check the output provided by VowSpace before using it in your research. I would greatly appreciate hearing your requests, recommendations, and thoughts on this project! For any inquiries, please contact me via email: alicagank[at]icloud[dot]com
License
VowSpace is licensed under the GNU General Public License v3.0.
Credits
VowSpace was developed by Ali Çağan Kaya as part of a linguistics project at Hacettepe University, Turkey. If you find this tool useful and decide to modify or publish it, kindly give credit to the original author.
References
Aydın, Ö., & Uzun, İ. P. (2020). Ünlü formant normalizasyonu: R programlama dilinde bir uygulama. In İ. P. Uzun (Ed.), Kuramsal ve uygulamalı sesbilim (pp. 297–322). Seçkin Yayıncılık.
Bladon, R. A. W., Henton, C. G., & Pickering, J. B. (1984). Towards an auditory theory of speaker normalization. Language & Communication, 4(1), 59–69. https://doi.org/https://doi.org/10.1016/0271-5309(84)90019-3
Boersma, Paul (2001). Praat, a system for doing phonetics by computer. Glot International 5:9/10, 341-345.
Clopper, C. G. (2009). Computational methods for normalizing acoustic vowel data for talker differences. Language and Linguistics Compass, 3(6), 1430–1442. https://doi.org/https://doi.org/10.1111/j.1749-818X.2009.00165.x
Fant, G. (1975). Non-uniform vowel normalization. Speech Transmission Laboratory Quarterly Progress and Status Report, 16, 1–19.
Gelfer, M. P., & Bennett, Q. E. (2013). Speaking Fundamental Frequency and Vowel Formant Frequencies: Effects on Perception of Gender. Journal of Voice, 27(5), 556–566. https://doi.org/10.1016/J.JVOICE.2012.11.008
Harris, C. R., Millman, K. J., van der Walt, S. J., Gommers, R., Virtanen, P., Cournapeau, D., Wieser, E., Taylor, J., Berg, S., Smith, N. J., Kern, R., Picus, M., Hoyer, S., van Kerkwijk, M. H., Brett, M., Haldane, A., del Río, J. F., Wiebe, M., Peterson, P., … Oliphant, T. E. (2020). Array programming with NumPy. Nature, 585(7825), 357–362. https://doi.org/10.1038/s41586-020-2649-2
Heeringa, W. & Van de Velde, H. (2018). “Visible Vowels: a Tool for the Visualization of Vowel Variation.” In Proceedings CLARIN Annual Conference 2018, 8 – 10 October, Pisa, Italy. CLARIN ERIC.
Hunter, J. D. (2007). Matplotlib: A 2D Graphics Environment. Computing in Science & Engineering, 9(3), 90–95. https://doi.org/10.1109/MCSE.2007.55
Jadoul, Y., Thompson, B., & de Boer, B. (2018). Introducing Parselmouth: A Python interface to Praat. Journal of Phonetics, 71, 1–15. https://doi.org/10.1016/j.wocn.2018.07.001
Jones, D. (1917). Speech sounds: Cardinal vowels. The Gramophone.
Joos, M. (1948). Acoustic phonetics. Language, 23, 5–136.
Klatt, D. H. (1989). Review of selected models of speech perception. In W. Marlsen-Wilson (Ed.), Lexical representation and process (pp. 169–226). MIT Press.
Ladefoged, P., & Broadbent, D. E. (1957). Information conveyed by vowels. The Journal of the Acoustical Society of America, 29(1), 98–104. https://doi.org/10.1121/1.1908694
Pfitzinger, H. R., & Niebuhr, O. (2011). Historical development of phonetic vowel systems: The last 400 years. ICPhS XVII, 160–163.
R Core Team. (2021). R: A language and environment for statistical computing. [Yazılım]. R Foundation for Statistical Computing, Vienna, Austria.
Emily Remirez. (2022, October 20). Vowel plotting in Python. In Linguistics Methods Hub. Zenodo. https://doi.org/10.5281/zenodo.7232005
Studdert-Kennedy, M. (1964). The perception of speech. In T. A. Sebeok (Ed.), Current trends in linguistic (pp. 2349–2385). Mouton.
Thomas, Erik R. and Tyler Kendall. 2007. NORM: The vowel normalization and plotting suite. [ Online Resource: http://ncslaap.lib.ncsu.edu/tools/norm/
The pandas development team. (2024). pandas-dev/pandas: Pandas (v2.2.2). Zenodo. https://doi.org/10.5281/zenodo.10957263
Van Rossum, G., & Drake, Jr. F. L. (1995). Python reference manual. Centrum voor Wiskunde en Informatica Amsterdam.
Virtanen, P., Gommers, R., Oliphant, T. E., Haberland, M., Reddy, T., Cournapeau, D., Burovski, E., Peterson, P., Weckesser, W., Bright, J., van der Walt, S. J., Brett, M., Wilson, J., Millman, K. J., Mayorov, N., Nelson, A. R. J., Jones, E., Kern, R., Larson, E., … Vázquez-Baeza, Y. (2020). SciPy 1.0: fundamental algorithms for scientific computing in Python. Nature Methods, 17(3), 261–272. https://doi.org/10.1038/s41592-019-0686-2
Watt, D., Fabricus, A. H., & Kendall, T. (2010). More on vowels: Plotting and normalization. In Sociophonetics: A Student’s Guide (pp. 107–118). Routledge.
